NYC Yellow Taxi Fare Prediction using Snowflake and Machine Learning#
# Install if needed:
# !pip install snowflake-connector-python python-dotenv pandas numpy scikit-learn scipy joblib matplotlib pyarrow
# !pip install xgboost
import os
import warnings
from pathlib import Path

import numpy as np
import pandas as pd
import matplotlib.pyplot as plt

from dotenv import load_dotenv
import snowflake.connector
from scipy.stats import randint, loguniform

from sklearn.model_selection import train_test_split, KFold, cross_validate, RandomizedSearchCV
from sklearn.compose import ColumnTransformer
from sklearn.pipeline import Pipeline
from sklearn.preprocessing import OneHotEncoder, RobustScaler
from sklearn.impute import SimpleImputer
from sklearn.metrics import mean_absolute_error, mean_squared_error, r2_score

from sklearn.dummy import DummyRegressor
from sklearn.linear_model import Ridge
from sklearn.tree import DecisionTreeRegressor
from sklearn.ensemble import RandomForestRegressor, HistGradientBoostingRegressor

import joblib

warnings.filterwarnings("ignore")
RANDOM_STATE = 42
pd.set_option("display.max_columns", 100)
Path("models").mkdir(exist_ok=True)
1. Control switches#
Defaults are intentionally machine-safe. Can be changed if you have powerful machine.
USE_FULL_DATASET = False
SAMPLE_SIZE = 500_000

RUN_XGBOOST = False
RUN_XGBOOST_TUNING = False

N_JOBS = 1
CV_SPLITS = 3
N_ITER_LIGHT_TUNING = 8

print("USE_FULL_DATASET:", USE_FULL_DATASET)
print("SAMPLE_SIZE:", SAMPLE_SIZE)
print("RUN_XGBOOST:", RUN_XGBOOST)
print("N_JOBS:", N_JOBS)
USE_FULL_DATASET: False
SAMPLE_SIZE: 500000
RUN_XGBOOST: False
N_JOBS: 1
2. Snowflake connection#
load_dotenv()

required_env_vars = [
    "NYC_SNOWFLAKE_USER",
    "NYC_SNOWFLAKE_PASSWORD",
    "NYC_SNOWFLAKE_ACCOUNT",
    "NYC_SNOWFLAKE_WAREHOUSE",
    "NYC_SNOWFLAKE_DATABASE",
    "NYC_SNOWFLAKE_SCHEMA",
    "NYC_SNOWFLAKE_ROLE",
]

missing_vars = [var for var in required_env_vars if not os.getenv(var)]
if missing_vars:
    raise ValueError(f"Missing these .env variables: {missing_vars}")

SF_DATABASE = os.getenv("NYC_SNOWFLAKE_DATABASE")
SF_SCHEMA = os.getenv("NYC_SNOWFLAKE_SCHEMA")
FQ_SCHEMA = f"{SF_DATABASE}.{SF_SCHEMA}"

print("Database:", SF_DATABASE)
print("Schema:", SF_SCHEMA)
print("Fully qualified schema:", FQ_SCHEMA)
Database: NYC
Schema: PUBLIC
Fully qualified schema: NYC.PUBLIC
def get_snowflake_connection():
    """Create Snowflake connection using NYC project environment variables."""
    return snowflake.connector.connect(
        user=os.getenv("NYC_SNOWFLAKE_USER"),
        password=os.getenv("NYC_SNOWFLAKE_PASSWORD"),
        account=os.getenv("NYC_SNOWFLAKE_ACCOUNT"),
        warehouse=os.getenv("NYC_SNOWFLAKE_WAREHOUSE"),
        database=os.getenv("NYC_SNOWFLAKE_DATABASE"),
        schema=os.getenv("NYC_SNOWFLAKE_SCHEMA"),
        role=os.getenv("NYC_SNOWFLAKE_ROLE"),
    )


def run_sql(query, return_df=True):
    """Run SQL in Snowflake and optionally return results as a pandas DataFrame."""
    conn = get_snowflake_connection()
    try:
        with conn.cursor() as cur:
            cur.execute(query)
            if not return_df or cur.description is None:
                return None
            rows = cur.fetchall()
            columns = [desc[0] for desc in cur.description]
            return pd.DataFrame(rows, columns=columns)
    finally:
        conn.close()


def show_sql_result(query):
    return run_sql(query, return_df=True)
connection_test_query = """
SELECT
    CURRENT_USER() AS current_user,
    CURRENT_ROLE() AS current_role,
    CURRENT_DATABASE() AS current_database,
    CURRENT_SCHEMA() AS current_schema,
    CURRENT_WAREHOUSE() AS current_warehouse;
"""
show_sql_result(connection_test_query)
| CURRENT_USER | CURRENT_ROLE | CURRENT_DATABASE | CURRENT_SCHEMA | CURRENT_WAREHOUSE | |
|---|---|---|---|---|---|
| 0 | ZG | ACCOUNTADMIN | NYC | PUBLIC | COMPUTE_WH |
3. Check monthly source tables#
monthly_count_query = f"""
SELECT 'NYC_JAN' AS table_name, COUNT(*) AS row_count FROM {FQ_SCHEMA}.NYC_JAN
UNION ALL
SELECT 'NYC_FEB' AS table_name, COUNT(*) AS row_count FROM {FQ_SCHEMA}.NYC_FEB
UNION ALL
SELECT 'NYC_MARCH' AS table_name, COUNT(*) AS row_count FROM {FQ_SCHEMA}.NYC_MARCH
UNION ALL
SELECT 'NYC_APRIL' AS table_name, COUNT(*) AS row_count FROM {FQ_SCHEMA}.NYC_APRIL
ORDER BY table_name;
"""
monthly_counts = show_sql_result(monthly_count_query)
monthly_counts
| TABLE_NAME | ROW_COUNT | |
|---|---|---|
| 0 | NYC_APRIL | 3800664 |
| 1 | NYC_FEB | 3399866 |
| 2 | NYC_JAN | 3724889 |
| 3 | NYC_MARCH | 3952451 |
print(f"Total raw rows across 4 months: {monthly_counts['ROW_COUNT'].sum():,}")
Total raw rows across 4 months: 14,877,870
schema_check_query = f"""
SELECT
    table_name,
    column_name,
    ordinal_position,
    data_type
FROM {SF_DATABASE}.information_schema.columns
WHERE table_schema = '{SF_SCHEMA}'
  AND table_name IN ('NYC_JAN', 'NYC_FEB', 'NYC_MARCH', 'NYC_APRIL')
ORDER BY table_name, ordinal_position;
"""
schema_check = show_sql_result(schema_check_query)
schema_check.head(100)
| TABLE_NAME | COLUMN_NAME | ORDINAL_POSITION | DATA_TYPE | |
|---|---|---|---|---|
| 0 | NYC_APRIL | VARIANT_COL | 1 | VARIANT |
| 1 | NYC_FEB | VARIANT_COL | 1 | VARIANT |
| 2 | NYC_JAN | VARIANT_COL | 1 | VARIANT |
| 3 | NYC_MARCH | VARIANT_COL | 1 | VARIANT |
4. Combine monthly tables and standardize column names#
actual_columns_query = f"""
SELECT
    table_name,
    ordinal_position,
    column_name,
    data_type
FROM {SF_DATABASE}.information_schema.columns
WHERE table_schema = '{SF_SCHEMA}'
  AND table_name = 'NYC_JAN'
ORDER BY ordinal_position;
"""

actual_columns = show_sql_result(actual_columns_query)
actual_columns
| TABLE_NAME | ORDINAL_POSITION | COLUMN_NAME | DATA_TYPE | |
|---|---|---|---|---|
| 0 | NYC_JAN | 1 | VARIANT_COL | VARIANT |
print(actual_columns["COLUMN_NAME"].tolist())
['VARIANT_COL']
create_raw_query = f"""
CREATE OR REPLACE TABLE {FQ_SCHEMA}.NYC_TAXI_RAW AS

SELECT
    VARIANT_COL:"VendorID"::INT AS vendor_id,
    TO_TIMESTAMP_NTZ(VARIANT_COL:"tpep_pickup_datetime"::NUMBER / 1000000) AS pickup_datetime,
    TO_TIMESTAMP_NTZ(VARIANT_COL:"tpep_dropoff_datetime"::NUMBER / 1000000) AS dropoff_datetime,
    VARIANT_COL:"passenger_count"::FLOAT AS passenger_count,
    VARIANT_COL:"trip_distance"::FLOAT AS trip_distance,
    VARIANT_COL:"RatecodeID"::FLOAT AS ratecode_id,
    VARIANT_COL:"store_and_fwd_flag"::STRING AS store_and_fwd_flag,
    VARIANT_COL:"PULocationID"::INT AS pu_location_id,
    VARIANT_COL:"DOLocationID"::INT AS do_location_id,
    VARIANT_COL:"payment_type"::INT AS payment_type,
    VARIANT_COL:"fare_amount"::FLOAT AS fare_amount,
    VARIANT_COL:"extra"::FLOAT AS extra,
    VARIANT_COL:"mta_tax"::FLOAT AS mta_tax,
    VARIANT_COL:"tip_amount"::FLOAT AS tip_amount,
    VARIANT_COL:"tolls_amount"::FLOAT AS tolls_amount,
    VARIANT_COL:"improvement_surcharge"::FLOAT AS improvement_surcharge,
    VARIANT_COL:"total_amount"::FLOAT AS total_amount,
    VARIANT_COL:"congestion_surcharge"::FLOAT AS congestion_surcharge,
    VARIANT_COL:"Airport_fee"::FLOAT AS airport_fee,
    VARIANT_COL:"cbd_congestion_fee"::FLOAT AS cbd_congestion_fee,
    '2026-01' AS data_month
FROM {FQ_SCHEMA}.NYC_JAN

UNION ALL

SELECT
    VARIANT_COL:"VendorID"::INT AS vendor_id,
    TO_TIMESTAMP_NTZ(VARIANT_COL:"tpep_pickup_datetime"::NUMBER / 1000000) AS pickup_datetime,
    TO_TIMESTAMP_NTZ(VARIANT_COL:"tpep_dropoff_datetime"::NUMBER / 1000000) AS dropoff_datetime,
    VARIANT_COL:"passenger_count"::FLOAT AS passenger_count,
    VARIANT_COL:"trip_distance"::FLOAT AS trip_distance,
    VARIANT_COL:"RatecodeID"::FLOAT AS ratecode_id,
    VARIANT_COL:"store_and_fwd_flag"::STRING AS store_and_fwd_flag,
    VARIANT_COL:"PULocationID"::INT AS pu_location_id,
    VARIANT_COL:"DOLocationID"::INT AS do_location_id,
    VARIANT_COL:"payment_type"::INT AS payment_type,
    VARIANT_COL:"fare_amount"::FLOAT AS fare_amount,
    VARIANT_COL:"extra"::FLOAT AS extra,
    VARIANT_COL:"mta_tax"::FLOAT AS mta_tax,
    VARIANT_COL:"tip_amount"::FLOAT AS tip_amount,
    VARIANT_COL:"tolls_amount"::FLOAT AS tolls_amount,
    VARIANT_COL:"improvement_surcharge"::FLOAT AS improvement_surcharge,
    VARIANT_COL:"total_amount"::FLOAT AS total_amount,
    VARIANT_COL:"congestion_surcharge"::FLOAT AS congestion_surcharge,
    VARIANT_COL:"Airport_fee"::FLOAT AS airport_fee,
    VARIANT_COL:"cbd_congestion_fee"::FLOAT AS cbd_congestion_fee,
    '2026-02' AS data_month
FROM {FQ_SCHEMA}.NYC_FEB

UNION ALL

SELECT
    VARIANT_COL:"VendorID"::INT AS vendor_id,
    TO_TIMESTAMP_NTZ(VARIANT_COL:"tpep_pickup_datetime"::NUMBER / 1000000) AS pickup_datetime,
    TO_TIMESTAMP_NTZ(VARIANT_COL:"tpep_dropoff_datetime"::NUMBER / 1000000) AS dropoff_datetime,
    VARIANT_COL:"passenger_count"::FLOAT AS passenger_count,
    VARIANT_COL:"trip_distance"::FLOAT AS trip_distance,
    VARIANT_COL:"RatecodeID"::FLOAT AS ratecode_id,
    VARIANT_COL:"store_and_fwd_flag"::STRING AS store_and_fwd_flag,
    VARIANT_COL:"PULocationID"::INT AS pu_location_id,
    VARIANT_COL:"DOLocationID"::INT AS do_location_id,
    VARIANT_COL:"payment_type"::INT AS payment_type,
    VARIANT_COL:"fare_amount"::FLOAT AS fare_amount,
    VARIANT_COL:"extra"::FLOAT AS extra,
    VARIANT_COL:"mta_tax"::FLOAT AS mta_tax,
    VARIANT_COL:"tip_amount"::FLOAT AS tip_amount,
    VARIANT_COL:"tolls_amount"::FLOAT AS tolls_amount,
    VARIANT_COL:"improvement_surcharge"::FLOAT AS improvement_surcharge,
    VARIANT_COL:"total_amount"::FLOAT AS total_amount,
    VARIANT_COL:"congestion_surcharge"::FLOAT AS congestion_surcharge,
    VARIANT_COL:"Airport_fee"::FLOAT AS airport_fee,
    VARIANT_COL:"cbd_congestion_fee"::FLOAT AS cbd_congestion_fee,
    '2026-03' AS data_month
FROM {FQ_SCHEMA}.NYC_MARCH

UNION ALL

SELECT
    VARIANT_COL:"VendorID"::INT AS vendor_id,
    TO_TIMESTAMP_NTZ(VARIANT_COL:"tpep_pickup_datetime"::NUMBER / 1000000) AS pickup_datetime,
    TO_TIMESTAMP_NTZ(VARIANT_COL:"tpep_dropoff_datetime"::NUMBER / 1000000) AS dropoff_datetime,
    VARIANT_COL:"passenger_count"::FLOAT AS passenger_count,
    VARIANT_COL:"trip_distance"::FLOAT AS trip_distance,
    VARIANT_COL:"RatecodeID"::FLOAT AS ratecode_id,
    VARIANT_COL:"store_and_fwd_flag"::STRING AS store_and_fwd_flag,
    VARIANT_COL:"PULocationID"::INT AS pu_location_id,
    VARIANT_COL:"DOLocationID"::INT AS do_location_id,
    VARIANT_COL:"payment_type"::INT AS payment_type,
    VARIANT_COL:"fare_amount"::FLOAT AS fare_amount,
    VARIANT_COL:"extra"::FLOAT AS extra,
    VARIANT_COL:"mta_tax"::FLOAT AS mta_tax,
    VARIANT_COL:"tip_amount"::FLOAT AS tip_amount,
    VARIANT_COL:"tolls_amount"::FLOAT AS tolls_amount,
    VARIANT_COL:"improvement_surcharge"::FLOAT AS improvement_surcharge,
    VARIANT_COL:"total_amount"::FLOAT AS total_amount,
    VARIANT_COL:"congestion_surcharge"::FLOAT AS congestion_surcharge,
    VARIANT_COL:"Airport_fee"::FLOAT AS airport_fee,
    VARIANT_COL:"cbd_congestion_fee"::FLOAT AS cbd_congestion_fee,
    '2026-04' AS data_month
FROM {FQ_SCHEMA}.NYC_APRIL;
"""

run_sql(create_raw_query, return_df=False)
print("Created table: NYC_TAXI_RAW")
Created table: NYC_TAXI_RAW
check_raw_query = f"""
SELECT
    vendor_id,
    pickup_datetime,
    dropoff_datetime,
    passenger_count,
    trip_distance,
    ratecode_id,
    pu_location_id,
    do_location_id,
    payment_type,
    fare_amount,
    data_month
FROM {FQ_SCHEMA}.NYC_TAXI_RAW
LIMIT 5;
"""

show_sql_result(check_raw_query)
| VENDOR_ID | PICKUP_DATETIME | DROPOFF_DATETIME | PASSENGER_COUNT | TRIP_DISTANCE | RATECODE_ID | PU_LOCATION_ID | DO_LOCATION_ID | PAYMENT_TYPE | FARE_AMOUNT | DATA_MONTH | |
|---|---|---|---|---|---|---|---|---|---|---|---|
| 0 | 2 | 2026-01-29 21:16:07 | 2026-01-29 21:26:28 | 1.0 | 1.19 | 1.0 | 107 | 161 | 1 | 10.7 | 2026-01 |
| 1 | 2 | 2026-01-29 21:21:43 | 2026-01-29 21:35:46 | 1.0 | 2.33 | 1.0 | 236 | 161 | 1 | 15.6 | 2026-01 |
| 2 | 2 | 2026-01-29 21:46:00 | 2026-01-29 22:02:24 | 2.0 | 4.59 | 1.0 | 144 | 140 | 1 | 22.6 | 2026-01 |
| 3 | 2 | 2026-01-29 21:05:39 | 2026-01-29 21:11:45 | 1.0 | 0.56 | 1.0 | 237 | 141 | 1 | 7.2 | 2026-01 |
| 4 | 2 | 2026-01-29 21:12:21 | 2026-01-29 21:24:05 | 1.0 | 0.97 | 1.0 | 90 | 186 | 1 | 11.4 | 2026-01 |
date_check_query = f"""
SELECT
    MIN(pickup_datetime) AS min_pickup,
    MAX(pickup_datetime) AS max_pickup,
    MIN(dropoff_datetime) AS min_dropoff,
    MAX(dropoff_datetime) AS max_dropoff
FROM {FQ_SCHEMA}.NYC_TAXI_RAW;
"""

show_sql_result(date_check_query)
| MIN_PICKUP | MAX_PICKUP | MIN_DROPOFF | MAX_DROPOFF | |
|---|---|---|---|---|
| 0 | 2001-01-01 09:23:58 | 2026-05-01 00:01:28 | 2001-01-01 16:09:38 | 2026-05-02 12:06:09 |
date_outlier_query = f"""
SELECT
    COUNT(*) AS total_rows,

    COUNT_IF(pickup_datetime < '2026-01-01') AS pickup_before_2026,
    COUNT_IF(pickup_datetime >= '2026-05-01') AS pickup_after_april,

    COUNT_IF(dropoff_datetime < '2026-01-01') AS dropoff_before_2026,
    COUNT_IF(dropoff_datetime >= '2026-05-03') AS dropoff_after_may_2

FROM {FQ_SCHEMA}.NYC_TAXI_RAW;
"""

show_sql_result(date_outlier_query)
| TOTAL_ROWS | PICKUP_BEFORE_2026 | PICKUP_AFTER_APRIL | DROPOFF_BEFORE_2026 | DROPOFF_AFTER_MAY_2 | |
|---|---|---|---|---|---|
| 0 | 14877870 | 12 | 1 | 8 | 0 |
5. Data quality checks before creating ML table#
missing_values_query = f"""
SELECT
    COUNT(*) AS total_rows,

    COUNT_IF(vendor_id IS NULL) AS missing_vendor_id,
    COUNT_IF(pickup_datetime IS NULL) AS missing_pickup_datetime,
    COUNT_IF(dropoff_datetime IS NULL) AS missing_dropoff_datetime,
    COUNT_IF(passenger_count IS NULL) AS missing_passenger_count,
    COUNT_IF(trip_distance IS NULL) AS missing_trip_distance,
    COUNT_IF(ratecode_id IS NULL) AS missing_ratecode_id,
    COUNT_IF(pu_location_id IS NULL) AS missing_pu_location_id,
    COUNT_IF(do_location_id IS NULL) AS missing_do_location_id,
    COUNT_IF(payment_type IS NULL) AS missing_payment_type,
    COUNT_IF(fare_amount IS NULL) AS missing_fare_amount

FROM {FQ_SCHEMA}.NYC_TAXI_RAW;
"""

show_sql_result(missing_values_query)
| TOTAL_ROWS | MISSING_VENDOR_ID | MISSING_PICKUP_DATETIME | MISSING_DROPOFF_DATETIME | MISSING_PASSENGER_COUNT | MISSING_TRIP_DISTANCE | MISSING_RATECODE_ID | MISSING_PU_LOCATION_ID | MISSING_DO_LOCATION_ID | MISSING_PAYMENT_TYPE | MISSING_FARE_AMOUNT | |
|---|---|---|---|---|---|---|---|---|---|---|---|
| 0 | 14877870 | 0 | 0 | 0 | 3856909 | 0 | 3856909 | 0 | 0 | 0 | 0 |
invalid_values_query = f"""
SELECT
    COUNT(*) AS total_rows,

    COUNT_IF(fare_amount <= 0) AS fare_le_0,
    COUNT_IF(fare_amount > 300) AS fare_gt_300,

    COUNT_IF(trip_distance <= 0) AS distance_le_0,
    COUNT_IF(trip_distance > 100) AS distance_gt_100,

    COUNT_IF(DATEDIFF('minute', pickup_datetime, dropoff_datetime) <= 0) AS duration_le_0,
    COUNT_IF(DATEDIFF('minute', pickup_datetime, dropoff_datetime) > 240) AS duration_gt_240,

    COUNT_IF(passenger_count <= 0) AS passenger_le_0,
    COUNT_IF(passenger_count > 6) AS passenger_gt_6,

    COUNT_IF(pickup_datetime < '2026-01-01') AS pickup_before_2026,
    COUNT_IF(pickup_datetime >= '2026-05-01') AS pickup_after_april,
    COUNT_IF(dropoff_datetime < '2026-01-01') AS dropoff_before_2026,
    COUNT_IF(dropoff_datetime >= '2026-05-03') AS dropoff_after_may_2

FROM {FQ_SCHEMA}.NYC_TAXI_RAW;
"""

show_sql_result(invalid_values_query)
| TOTAL_ROWS | FARE_LE_0 | FARE_GT_300 | DISTANCE_LE_0 | DISTANCE_GT_100 | DURATION_LE_0 | DURATION_GT_240 | PASSENGER_LE_0 | PASSENGER_GT_6 | PICKUP_BEFORE_2026 | PICKUP_AFTER_APRIL | DROPOFF_BEFORE_2026 | DROPOFF_AFTER_MAY_2 | |
|---|---|---|---|---|---|---|---|---|---|---|---|---|---|
| 0 | 14877870 | 111594 | 1768 | 463348 | 631 | 263722 | 4883 | 52330 | 18 | 12 | 1 | 8 | 0 |
6. Create ML-ready table#
This version includes date filters because we found a few dirty datetime outliers.
Leakage columns are intentionally excluded from the ML table.
create_ml_ready_query = f"""
CREATE OR REPLACE TABLE {FQ_SCHEMA}.NYC_TAXI_ML_READY AS

SELECT
    -- target
    fare_amount,

    -- numerical predictors
    trip_distance,
    DATEDIFF('minute', pickup_datetime, dropoff_datetime) AS trip_duration_minutes,
    passenger_count,

    -- categorical predictors
    vendor_id,
    ratecode_id,
    pu_location_id,
    do_location_id,
    payment_type,

    -- time-based predictors
    EXTRACT(hour FROM pickup_datetime) AS pickup_hour,
    DAYOFWEEKISO(pickup_datetime) AS pickup_day_of_week,
    EXTRACT(month FROM pickup_datetime) AS pickup_month,

    CASE
        WHEN DAYOFWEEKISO(pickup_datetime) IN (6, 7) THEN 1
        ELSE 0
    END AS is_weekend,

    data_month

FROM {FQ_SCHEMA}.NYC_TAXI_RAW

WHERE fare_amount BETWEEN 2.5 AND 300
  AND trip_distance BETWEEN 0.1 AND 100
  AND DATEDIFF('minute', pickup_datetime, dropoff_datetime) BETWEEN 1 AND 240
  AND passenger_count BETWEEN 1 AND 6
  AND passenger_count IS NOT NULL
  AND ratecode_id IS NOT NULL
  AND pickup_datetime IS NOT NULL
  AND dropoff_datetime IS NOT NULL

  -- date filters remove a tiny number of dirty/outlier rows
  AND pickup_datetime >= '2026-01-01'
  AND pickup_datetime < '2026-05-01'
  AND dropoff_datetime >= '2026-01-01'
  AND dropoff_datetime < '2026-05-03';
"""

run_sql(create_ml_ready_query, return_df=False)
print("Created table: NYC_TAXI_ML_READY")
Created table: NYC_TAXI_ML_READY
ml_ready_summary_query = f"""
SELECT
    COUNT(*) AS clean_rows,

    MIN(fare_amount) AS min_fare,
    MAX(fare_amount) AS max_fare,
    AVG(fare_amount) AS avg_fare,

    MIN(trip_distance) AS min_distance,
    MAX(trip_distance) AS max_distance,
    AVG(trip_distance) AS avg_distance,

    MIN(trip_duration_minutes) AS min_duration,
    MAX(trip_duration_minutes) AS max_duration,
    AVG(trip_duration_minutes) AS avg_duration,

    MIN(pickup_month) AS min_pickup_month,
    MAX(pickup_month) AS max_pickup_month

FROM {FQ_SCHEMA}.NYC_TAXI_ML_READY;
"""

show_sql_result(ml_ready_summary_query)
| CLEAN_ROWS | MIN_FARE | MAX_FARE | AVG_FARE | MIN_DISTANCE | MAX_DISTANCE | AVG_DISTANCE | MIN_DURATION | MAX_DURATION | AVG_DURATION | MIN_PICKUP_MONTH | MAX_PICKUP_MONTH | |
|---|---|---|---|---|---|---|---|---|---|---|---|---|
| 0 | 10545235 | 2.5 | 300.0 | 19.574414 | 0.1 | 97.4 | 3.446375 | 1 | 240 | 17.502948 | 1 | 4 |
clean_monthly_query = f"""
SELECT
    data_month,
    COUNT(*) AS clean_rows
FROM {FQ_SCHEMA}.NYC_TAXI_ML_READY
GROUP BY data_month
ORDER BY data_month;
"""

show_sql_result(clean_monthly_query)
| DATA_MONTH | CLEAN_ROWS | |
|---|---|---|
| 0 | 2026-01 | 2496316 |
| 1 | 2026-02 | 2259400 |
| 2 | 2026-03 | 2878703 |
| 3 | 2026-04 | 2910816 |
7. Useful SQL-based EDA#
eda_by_month_query = f"""
SELECT
    data_month,
    COUNT(*) AS trips,
    AVG(fare_amount) AS avg_fare,
    MEDIAN(fare_amount) AS median_fare,
    AVG(trip_distance) AS avg_distance,
    AVG(trip_duration_minutes) AS avg_duration
FROM {FQ_SCHEMA}.NYC_TAXI_ML_READY
GROUP BY data_month
ORDER BY data_month;
"""

eda_by_month = show_sql_result(eda_by_month_query)
eda_by_month
| DATA_MONTH | TRIPS | AVG_FARE | MEDIAN_FARE | AVG_DISTANCE | AVG_DURATION | |
|---|---|---|---|---|---|---|
| 0 | 2026-01 | 2496316 | 19.376844 | 12.8 | 3.447560 | 16.945891 |
| 1 | 2026-02 | 2259400 | 19.565755 | 13.5 | 3.379681 | 17.674644 |
| 2 | 2026-03 | 2878703 | 19.501310 | 13.5 | 3.477024 | 17.368610 |
| 3 | 2026-04 | 2910816 | 19.822869 | 14.2 | 3.466818 | 17.980263 |
eda_by_hour_query = f"""
SELECT
    pickup_hour,
    COUNT(*) AS trips,
    AVG(fare_amount) AS avg_fare,
    AVG(trip_distance) AS avg_distance,
    AVG(trip_duration_minutes) AS avg_duration
FROM {FQ_SCHEMA}.NYC_TAXI_ML_READY
GROUP BY pickup_hour
ORDER BY pickup_hour;
"""

eda_by_hour = show_sql_result(eda_by_hour_query)
eda_by_hour.head(24)
| PICKUP_HOUR | TRIPS | AVG_FARE | AVG_DISTANCE | AVG_DURATION | |
|---|---|---|---|---|---|
| 0 | 0 | 251170 | 20.402111 | 4.039580 | 14.338990 |
| 1 | 1 | 160663 | 18.156350 | 3.469898 | 13.258560 |
| 2 | 2 | 102260 | 16.828224 | 3.117607 | 12.147761 |
| 3 | 3 | 70705 | 17.764234 | 3.424628 | 12.402362 |
| 4 | 4 | 50598 | 23.953979 | 5.148001 | 16.479861 |
| 5 | 5 | 66165 | 28.717718 | 6.756405 | 22.582695 |
| 6 | 6 | 142694 | 24.416208 | 5.486035 | 22.117391 |
| 7 | 7 | 283712 | 20.157632 | 3.982481 | 19.250624 |
| 8 | 8 | 398259 | 18.837170 | 3.355469 | 18.258432 |
| 9 | 9 | 462440 | 18.776611 | 3.208695 | 17.927087 |
| 10 | 10 | 500893 | 19.086660 | 3.199018 | 18.068136 |
| 11 | 11 | 540905 | 19.275365 | 3.157614 | 18.413355 |
| 12 | 12 | 583452 | 19.483467 | 3.208477 | 18.419003 |
| 13 | 13 | 604152 | 20.005188 | 3.341255 | 18.855162 |
| 14 | 14 | 651619 | 20.829233 | 3.517116 | 19.962535 |
| 15 | 15 | 685615 | 20.874923 | 3.521095 | 20.327280 |
| 16 | 16 | 699277 | 20.675885 | 3.519539 | 20.114016 |
| 17 | 17 | 750767 | 19.038644 | 3.133854 | 18.069177 |
| 18 | 18 | 760540 | 17.875805 | 2.955669 | 16.074911 |
| 19 | 19 | 660770 | 18.329346 | 3.237371 | 15.339322 |
| 20 | 20 | 610341 | 18.841253 | 3.456789 | 15.137187 |
| 21 | 21 | 614027 | 18.949910 | 3.476630 | 15.093559 |
| 22 | 22 | 521937 | 19.647157 | 3.656979 | 15.281302 |
| 23 | 23 | 372274 | 20.749590 | 4.051421 | 15.168175 |
eda_by_ratecode_query = f"""
SELECT
    ratecode_id,
    COUNT(*) AS trips,
    AVG(fare_amount) AS avg_fare,
    MEDIAN(fare_amount) AS median_fare,
    AVG(trip_distance) AS avg_distance,
    AVG(trip_duration_minutes) AS avg_duration
FROM {FQ_SCHEMA}.NYC_TAXI_ML_READY
GROUP BY ratecode_id
ORDER BY trips DESC;
"""

eda_by_ratecode = show_sql_result(eda_by_ratecode_query)
eda_by_ratecode
| RATECODE_ID | TRIPS | AVG_FARE | MEDIAN_FARE | AVG_DISTANCE | AVG_DURATION | |
|---|---|---|---|---|---|---|
| 0 | 1.0 | 9609028 | 16.292351 | 12.8 | 2.563169 | 14.502367 |
| 1 | 99.0 | 493831 | 34.939160 | 33.5 | 8.845715 | 50.749463 |
| 2 | 2.0 | 316122 | 70.002401 | 70.0 | 17.950077 | 50.482431 |
| 3 | 5.0 | 57727 | 75.327019 | 72.0 | 9.588418 | 28.227727 |
| 4 | 3.0 | 38863 | 77.597688 | 81.1 | 13.824063 | 35.688676 |
| 5 | 4.0 | 29661 | 105.043818 | 96.8 | 19.548211 | 39.860322 |
| 6 | 6.0 | 3 | 2.833333 | 2.5 | 0.466667 | 3.000000 |
8. Pull modeling data into Python#
if USE_FULL_DATASET:
    modeling_query = f"""
    SELECT *
    FROM {FQ_SCHEMA}.NYC_TAXI_ML_READY;
    """
else:
    modeling_query = f"""
    SELECT *
    FROM {FQ_SCHEMA}.NYC_TAXI_ML_READY
    ORDER BY RANDOM()
    LIMIT {SAMPLE_SIZE};
    """

df = show_sql_result(modeling_query)
df.columns = df.columns.str.lower()

print(df.shape)
df.head()
(500000, 14)
| fare_amount | trip_distance | trip_duration_minutes | passenger_count | vendor_id | ratecode_id | pu_location_id | do_location_id | payment_type | pickup_hour | pickup_day_of_week | pickup_month | is_weekend | data_month | |
|---|---|---|---|---|---|---|---|---|---|---|---|---|---|---|
| 0 | 10.0 | 0.53 | 9 | 1.0 | 2 | 1.0 | 170 | 170 | 1 | 9 | 2 | 4 | 0 | 2026-04 |
| 1 | 47.1 | 10.20 | 34 | 1.0 | 2 | 1.0 | 230 | 138 | 1 | 13 | 4 | 1 | 0 | 2026-01 |
| 2 | 11.4 | 1.37 | 11 | 1.0 | 2 | 1.0 | 158 | 186 | 1 | 16 | 4 | 2 | 0 | 2026-02 |
| 3 | 7.9 | 0.67 | 8 | 4.0 | 2 | 1.0 | 161 | 162 | 1 | 19 | 7 | 4 | 1 | 2026-04 |
| 4 | 16.3 | 0.99 | 20 | 1.0 | 2 | 1.0 | 229 | 237 | 1 | 11 | 5 | 2 | 0 | 2026-02 |
df.info()
<class 'pandas.core.frame.DataFrame'>
RangeIndex: 500000 entries, 0 to 499999
Data columns (total 14 columns):
 #   Column                 Non-Null Count   Dtype
---  ------                 --------------   -----
 0   fare_amount            500000 non-null  float64
 1   trip_distance          500000 non-null  float64
 2   trip_duration_minutes  500000 non-null  int64
 3   passenger_count        500000 non-null  float64
 4   vendor_id              500000 non-null  int64
 5   ratecode_id            500000 non-null  float64
 6   pu_location_id         500000 non-null  int64
 7   do_location_id         500000 non-null  int64
 8   payment_type           500000 non-null  int64
 9   pickup_hour            500000 non-null  int64
 10  pickup_day_of_week     500000 non-null  int64
 11  pickup_month           500000 non-null  int64
 12  is_weekend             500000 non-null  int64
 13  data_month             500000 non-null  object
dtypes: float64(4), int64(9), object(1)
memory usage: 53.4+ MB
df.describe(include="all").T
| count | unique | top | freq | mean | std | min | 25% | 50% | 75% | max | |
|---|---|---|---|---|---|---|---|---|---|---|---|
| fare_amount | 500000.0 | NaN | NaN | NaN | 19.563764 | 17.460914 | 3.0 | 9.3 | 13.5 | 22.5 | 300.0 |
| trip_distance | 500000.0 | NaN | NaN | NaN | 3.445443 | 4.531362 | 0.1 | 1.0 | 1.7 | 3.38 | 90.22 |
| trip_duration_minutes | 500000.0 | NaN | NaN | NaN | 17.487018 | 15.459911 | 1.0 | 8.0 | 13.0 | 21.0 | 240.0 |
| passenger_count | 500000.0 | NaN | NaN | NaN | 1.242968 | 0.635823 | 1.0 | 1.0 | 1.0 | 1.0 | 6.0 |
| vendor_id | 500000.0 | NaN | NaN | NaN | 1.780898 | 0.413638 | 1.0 | 2.0 | 2.0 | 2.0 | 2.0 |
| ratecode_id | 500000.0 | NaN | NaN | NaN | 5.638546 | 20.65409 | 1.0 | 1.0 | 1.0 | 1.0 | 99.0 |
| pu_location_id | 500000.0 | NaN | NaN | NaN | 165.143564 | 63.780413 | 1.0 | 132.0 | 162.0 | 234.0 | 265.0 |
| do_location_id | 500000.0 | NaN | NaN | NaN | 164.66664 | 69.582472 | 1.0 | 114.0 | 162.0 | 234.0 | 265.0 |
| payment_type | 500000.0 | NaN | NaN | NaN | 1.138838 | 0.404903 | 1.0 | 1.0 | 1.0 | 1.0 | 4.0 |
| pickup_hour | 500000.0 | NaN | NaN | NaN | 14.388438 | 5.578265 | 0.0 | 11.0 | 15.0 | 19.0 | 23.0 |
| pickup_day_of_week | 500000.0 | NaN | NaN | NaN | 3.981094 | 1.885927 | 1.0 | 2.0 | 4.0 | 6.0 | 7.0 |
| pickup_month | 500000.0 | NaN | NaN | NaN | 2.587442 | 1.125172 | 1.0 | 2.0 | 3.0 | 4.0 | 4.0 |
| is_weekend | 500000.0 | NaN | NaN | NaN | 0.25888 | 0.43802 | 0.0 | 0.0 | 0.0 | 1.0 | 1.0 |
| data_month | 500000 | 4 | 2026-04 | 137676 | NaN | NaN | NaN | NaN | NaN | NaN | NaN |
9. Target and predictors#
target = "fare_amount"

numeric_features = [
    "trip_distance",
    "trip_duration_minutes",
    "passenger_count",
]

categorical_features = [
    "vendor_id",
    "ratecode_id",
    "pu_location_id",
    "do_location_id",
    "payment_type",
    "pickup_hour",
    "pickup_day_of_week",
    "pickup_month",
    "is_weekend",
    "data_month",
]

features = numeric_features + categorical_features
X = df[features].copy()
y = df[target].copy()

for col in numeric_features:
    X[col] = pd.to_numeric(X[col], errors="coerce")
for col in categorical_features:
    X[col] = X[col].astype("string")
y = pd.to_numeric(y, errors="coerce")

print("X shape:", X.shape)
print("y shape:", y.shape)
X shape: (500000, 13)
y shape: (500000,)
10. Train/test split#
Large dataset, so 99/1 is enough. With 500k rows (in sample dataset), test has around 5k rows.
X_train, X_test, y_train, y_test = train_test_split(
    X,
    y,
    test_size=0.01,
    random_state=RANDOM_STATE
)
print("Train:", X_train.shape)
print("Test:", X_test.shape)
Train: (495000, 13)
Test: (5000, 13)
11. Preprocessing pipeline#
from sklearn.preprocessing import OneHotEncoder, RobustScaler, OrdinalEncoder

numeric_transformer_ohe = Pipeline(steps=[
    ("imputer", SimpleImputer(strategy="median")),
    ("scaler", RobustScaler())
])

categorical_transformer_ohe = Pipeline(steps=[
    ("imputer", SimpleImputer(strategy="most_frequent")),
    ("onehot", OneHotEncoder(handle_unknown="ignore", sparse_output=True))
])

ohe_preprocessor = ColumnTransformer(
    transformers=[
        ("num", numeric_transformer_ohe, numeric_features),
        ("cat", categorical_transformer_ohe, categorical_features),
    ],
    remainder="drop"
)

numeric_transformer_ordinal = Pipeline(steps=[
    ("imputer", SimpleImputer(strategy="median"))
])

categorical_transformer_ordinal = Pipeline(steps=[
    ("imputer", SimpleImputer(strategy="most_frequent")),
    ("ordinal", OrdinalEncoder(
        handle_unknown="use_encoded_value",
        unknown_value=-1
    ))
])

ordinal_preprocessor = ColumnTransformer(
    transformers=[
        ("num", numeric_transformer_ordinal, numeric_features),
        ("cat", categorical_transformer_ordinal, categorical_features),
    ],
    remainder="drop"
)
12. Metric helpers#
def regression_metrics(y_true, y_pred):
    mae = mean_absolute_error(y_true, y_pred)
    rmse = mean_squared_error(y_true, y_pred) ** 0.5
    r2 = r2_score(y_true, y_pred)
    return {"MAE": mae, "RMSE": rmse, "R2": r2}


def evaluate_on_test(name, model, X_test, y_test):
    predictions = model.predict(X_test)
    metrics = regression_metrics(y_test, predictions)
    return {
        "model": name,
        "test_MAE": metrics["MAE"],
        "test_RMSE": metrics["RMSE"],
        "test_R2": metrics["R2"],
    }

cv = KFold(n_splits=CV_SPLITS, shuffle=True, random_state=RANDOM_STATE)
scoring = {
    "MAE": "neg_mean_absolute_error",
    "RMSE": "neg_root_mean_squared_error",
    "R2": "r2",
}
13. Baseline models with cross-validation#
baseline_models = {
    "Dummy Mean Baseline": Pipeline(steps=[
        ("preprocessor", ohe_preprocessor),
        ("model", DummyRegressor(strategy="mean"))
    ]),

    "Ridge Regression": Pipeline(steps=[
        ("preprocessor", ohe_preprocessor),
        ("model", Ridge(alpha=1.0))
    ]),

    "Decision Tree": Pipeline(steps=[
        ("preprocessor", ohe_preprocessor),
        ("model", DecisionTreeRegressor(
            max_depth=18,
            min_samples_leaf=30,
            random_state=RANDOM_STATE
        ))
    ]),

    "Random Forest": Pipeline(steps=[
        ("preprocessor", ohe_preprocessor),
        ("model", RandomForestRegressor(
            n_estimators=50,
            max_depth=18,
            min_samples_leaf=20,
            max_features="sqrt",
            random_state=RANDOM_STATE,
            n_jobs=N_JOBS
        ))
    ]),

    "HistGradientBoosting": Pipeline(steps=[
        ("preprocessor", ordinal_preprocessor),
        ("model", HistGradientBoostingRegressor(
            max_iter=250,
            learning_rate=0.08,
            max_leaf_nodes=31,
            min_samples_leaf=50,
            l2_regularization=0.1,
            random_state=RANDOM_STATE
        ))
    ]),
}

if RUN_XGBOOST:
    try:
        from xgboost import XGBRegressor

        baseline_models["XGBoost"] = Pipeline(steps=[
            ("preprocessor", ordinal_preprocessor),
            ("model", XGBRegressor(
                n_estimators=400,
                learning_rate=0.05,
                max_depth=7,
                subsample=0.8,
                colsample_bytree=0.8,
                objective="reg:squarederror",
                tree_method="hist",
                random_state=RANDOM_STATE,
                n_jobs=N_JOBS
            ))
        ])

        print("XGBoost is available and added.")

    except ImportError:
        print("XGBoost is not installed. Skipping XGBoost.")
else:
    print("XGBoost is turned off. Set RUN_XGBOOST = True to use it.")

baseline_models.keys()
XGBoost is turned off. Set RUN_XGBOOST = True to use it.
dict_keys(['Dummy Mean Baseline', 'Ridge Regression', 'Decision Tree', 'Random Forest', 'HistGradientBoosting'])
cv_results = []

for name, model in baseline_models.items():
    print(f"Cross-validating: {name}")
    scores = cross_validate(
        model,
        X_train,
        y_train,
        cv=cv,
        scoring=scoring,
        n_jobs=N_JOBS,
        return_train_score=True
    )
    cv_results.append({
        "model": name,
        "cv_train_MAE": -scores["train_MAE"].mean(),
        "cv_valid_MAE": -scores["test_MAE"].mean(),
        "cv_train_RMSE": -scores["train_RMSE"].mean(),
        "cv_valid_RMSE": -scores["test_RMSE"].mean(),
        "cv_train_R2": scores["train_R2"].mean(),
        "cv_valid_R2": scores["test_R2"].mean(),
    })

cv_results_df = pd.DataFrame(cv_results).sort_values("cv_valid_MAE")
cv_results_df
Cross-validating: Dummy Mean Baseline
Cross-validating: Ridge Regression
Cross-validating: Decision Tree
Cross-validating: Random Forest
Cross-validating: HistGradientBoosting
| model | cv_train_MAE | cv_valid_MAE | cv_train_RMSE | cv_valid_RMSE | cv_train_R2 | cv_valid_R2 | |
|---|---|---|---|---|---|---|---|
| 4 | HistGradientBoosting | 0.758658 | 0.783326 | 2.392685 | 2.633957 | 0.981206 | 0.977245 |
| 2 | Decision Tree | 0.748538 | 0.796732 | 2.547183 | 2.736460 | 0.978720 | 0.975437 |
| 1 | Ridge Regression | 2.117844 | 2.126414 | 4.429001 | 4.461660 | 0.935662 | 0.934707 |
| 3 | Random Forest | 3.487880 | 3.493286 | 5.961819 | 5.985009 | 0.883352 | 0.882460 |
| 0 | Dummy Mean Baseline | 11.785576 | 11.785674 | 17.461243 | 17.461195 | 0.000000 | -0.000018 |
14. Light hyperparameter tuning#
tuned_models = {}

dt_pipeline = Pipeline(steps=[
    ("preprocessor", ohe_preprocessor),
    ("model", DecisionTreeRegressor(random_state=RANDOM_STATE))
])

dt_params = {
    "model__max_depth": randint(8, 28),
    "model__min_samples_split": randint(20, 120),
    "model__min_samples_leaf": randint(10, 100),
}

dt_search = RandomizedSearchCV(
    estimator=dt_pipeline,
    param_distributions=dt_params,
    n_iter=N_ITER_LIGHT_TUNING,
    scoring="neg_mean_absolute_error",
    cv=cv,
    random_state=RANDOM_STATE,
    n_jobs=-1,
    verbose=1
)

dt_search.fit(X_train, y_train)
tuned_models["Tuned Decision Tree"] = dt_search.best_estimator_

print("Decision Tree best CV MAE:", -dt_search.best_score_)
print("Decision Tree best params:", dt_search.best_params_)
Fitting 3 folds for each of 8 candidates, totalling 24 fits
Decision Tree best CV MAE: 0.7916287106573519
Decision Tree best params: {'model__max_depth': 13, 'model__min_samples_leaf': 11, 'model__min_samples_split': 83}
rf_pipeline = Pipeline(steps=[
    ("preprocessor", ohe_preprocessor),
    ("model", RandomForestRegressor(
        random_state=RANDOM_STATE,
        n_jobs=-1
    ))
])

rf_params = {
    "model__n_estimators": randint(40, 90),
    "model__max_depth": randint(10, 24),
    "model__min_samples_leaf": randint(10, 80),
    "model__max_features": ["sqrt", 0.5],
}

rf_search = RandomizedSearchCV(
    estimator=rf_pipeline,
    param_distributions=rf_params,
    n_iter=N_ITER_LIGHT_TUNING,
    scoring="neg_mean_absolute_error",
    cv=cv,
    random_state=RANDOM_STATE,
    n_jobs=-1,
    verbose=1
)

rf_search.fit(X_train, y_train)
tuned_models["Tuned Random Forest"] = rf_search.best_estimator_

print("Random Forest best CV MAE:", -rf_search.best_score_)
print("Random Forest best params:", rf_search.best_params_)
Fitting 3 folds for each of 8 candidates, totalling 24 fits
Random Forest best CV MAE: 0.7416247552847682
Random Forest best params: {'model__max_depth': 16, 'model__max_features': 0.5, 'model__min_samples_leaf': 24, 'model__n_estimators': 82}
# # Optional XGBoost light tuning. Default is OFF.
# if RUN_XGBOOST and RUN_XGBOOST_TUNING:
#     from xgboost import XGBRegressor
#     xgb_pipeline = Pipeline(steps=[
#         ("preprocessor", preprocessor),
#         ("model", XGBRegressor(
#             objective="reg:squarederror",
#             tree_method="hist",
#             random_state=RANDOM_STATE,
#             n_jobs=N_JOBS
#         ))
#     ])
#     xgb_params = {
#         "model__n_estimators": randint(200, 600),
#         "model__learning_rate": loguniform(0.03, 0.12),
#         "model__max_depth": randint(4, 9),
#         "model__subsample": [0.75, 0.85, 1.0],
#         "model__colsample_bytree": [0.75, 0.85, 1.0],
#         "model__reg_lambda": loguniform(0.1, 10.0),
#     }
#     xgb_search = RandomizedSearchCV(
#         estimator=xgb_pipeline,
#         param_distributions=xgb_params,
#         n_iter=N_ITER_LIGHT_TUNING,
#         scoring="neg_mean_absolute_error",
#         cv=cv,
#         random_state=RANDOM_STATE,
#         n_jobs=N_JOBS,
#         verbose=1
#     )
#     xgb_search.fit(X_train, y_train)
#     tuned_models["Tuned XGBoost"] = xgb_search.best_estimator_
#     print("XGBoost best CV MAE:", -xgb_search.best_score_)
#     print("XGBoost best params:", xgb_search.best_params_)
# else:
#     print("XGBoost tuning skipped.")
15. Final test evaluation#
candidate_models = {}

for name, model in baseline_models.items():
    print(f"Fitting baseline candidate: {name}")
    model.fit(X_train, y_train)
    candidate_models[name] = model

candidate_models.update(tuned_models)

test_results = []
for name, model in candidate_models.items():
    test_results.append(evaluate_on_test(name, model, X_test, y_test))

test_results_df = pd.DataFrame(test_results).sort_values("test_MAE")
test_results_df
Fitting baseline candidate: Dummy Mean Baseline
Fitting baseline candidate: Ridge Regression
Fitting baseline candidate: Decision Tree
Fitting baseline candidate: Random Forest
Fitting baseline candidate: HistGradientBoosting
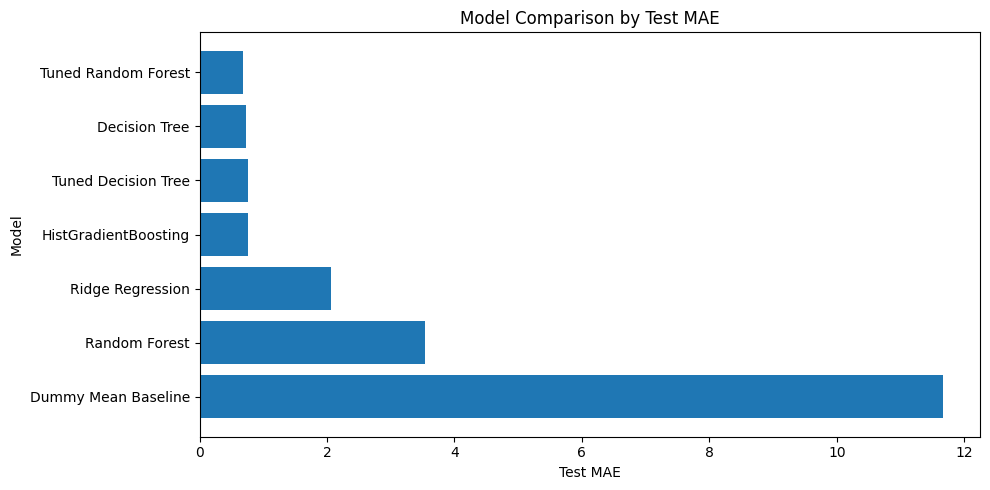
| model | test_MAE | test_RMSE | test_R2 | |
|---|---|---|---|---|
| 6 | Tuned Random Forest | 0.689086 | 2.145990 | 0.984823 |
| 2 | Decision Tree | 0.727596 | 2.224278 | 0.983696 |
| 5 | Tuned Decision Tree | 0.760811 | 2.652984 | 0.976805 |
| 4 | HistGradientBoosting | 0.761641 | 2.771296 | 0.974690 |
| 1 | Ridge Regression | 2.069953 | 4.338331 | 0.937975 |
| 3 | Random Forest | 3.534268 | 5.974078 | 0.882386 |
| 0 | Dummy Mean Baseline | 11.663953 | 17.419975 | -0.000031 |
16. Model comparison plot#
plot_df = test_results_df.sort_values("test_MAE", ascending=True)

plt.figure(figsize=(10, 5))
plt.barh(plot_df["model"], plot_df["test_MAE"])
plt.xlabel("Test MAE")
plt.ylabel("Model")
plt.title("Model Comparison by Test MAE")
plt.gca().invert_yaxis()
plt.tight_layout()
plt.show()
17. Save best model#
best_model_name = test_results_df.iloc[0]["model"]
best_model = candidate_models[best_model_name]
print(f"Best model: {best_model_name}")

model_path = Path("models") / "best_nyc_taxi_fare_model.joblib"
joblib.dump(best_model, model_path)
print(f"Saved model to: {model_path}")
Best model: Tuned Random Forest
Saved model to: models\best_nyc_taxi_fare_model.joblib
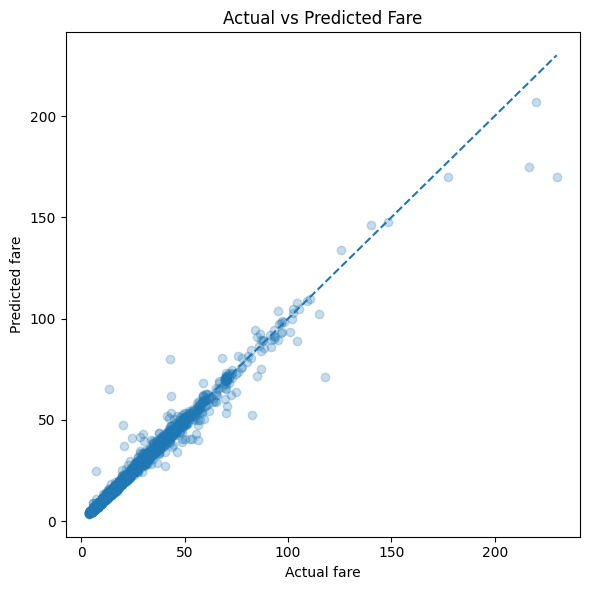
18. Actual vs predicted fare plot#
test_predictions = best_model.predict(X_test)

prediction_df = pd.DataFrame({
    "actual_fare": y_test.values,
    "predicted_fare": test_predictions
})

plot_sample = prediction_df.sample(n=min(5000, len(prediction_df)), random_state=RANDOM_STATE)

plt.figure(figsize=(6, 6))
plt.scatter(plot_sample["actual_fare"], plot_sample["predicted_fare"], alpha=0.25)
plt.xlabel("Actual fare")
plt.ylabel("Predicted fare")
plt.title("Actual vs Predicted Fare")

min_value = min(plot_sample["actual_fare"].min(), plot_sample["predicted_fare"].min())
max_value = max(plot_sample["actual_fare"].max(), plot_sample["predicted_fare"].max())
plt.plot([min_value, max_value], [min_value, max_value], linestyle="--")

plt.tight_layout()
plt.show()
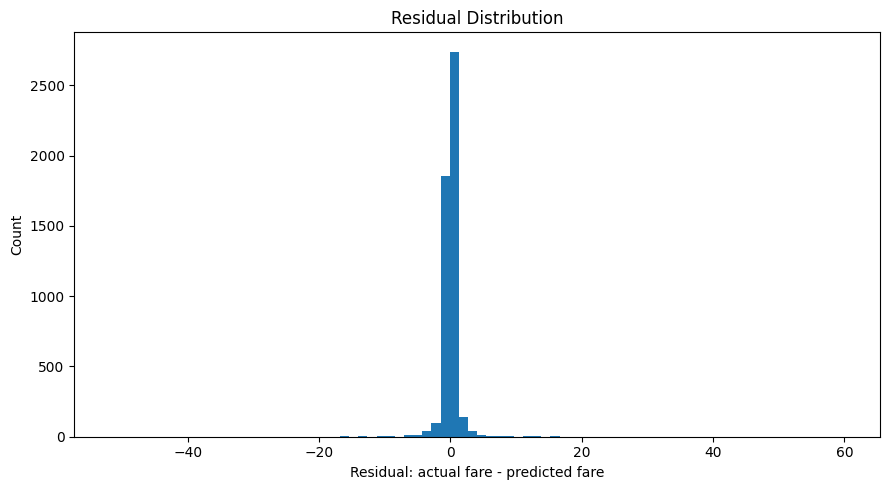
19. Residual / error distribution#
prediction_df["residual"] = prediction_df["actual_fare"] - prediction_df["predicted_fare"]
prediction_df["absolute_error"] = np.abs(prediction_df["residual"])

plt.figure(figsize=(9, 5))
plt.hist(prediction_df["residual"], bins=80)
plt.xlabel("Residual: actual fare - predicted fare")
plt.ylabel("Count")
plt.title("Residual Distribution")
plt.tight_layout()
plt.show()
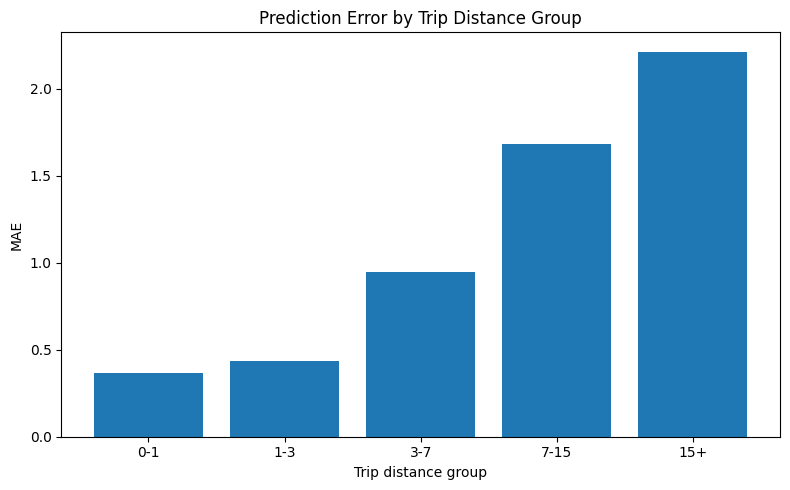
20. Error by trip distance group#
error_df = X_test.copy()
error_df["actual_fare"] = y_test.values
error_df["predicted_fare"] = test_predictions
error_df["absolute_error"] = np.abs(error_df["actual_fare"] - error_df["predicted_fare"])

error_df["distance_group"] = pd.cut(
    error_df["trip_distance"],
    bins=[0, 1, 3, 7, 15, 100],
    labels=["0-1", "1-3", "3-7", "7-15", "15+"]
)

distance_error = (
    error_df
    .groupby("distance_group", observed=True)
    .agg(
        trips=("absolute_error", "size"),
        mean_actual_fare=("actual_fare", "mean"),
        mean_predicted_fare=("predicted_fare", "mean"),
        mae=("absolute_error", "mean")
    )
    .reset_index()
)

distance_error
| distance_group | trips | mean_actual_fare | mean_predicted_fare | mae | |
|---|---|---|---|---|---|
| 0 | 0-1 | 1258 | 7.932591 | 7.998384 | 0.366700 |
| 1 | 1-3 | 2314 | 13.910169 | 13.922303 | 0.433299 |
| 2 | 3-7 | 742 | 25.725364 | 25.664879 | 0.948219 |
| 3 | 7-15 | 454 | 43.598238 | 43.469495 | 1.683677 |
| 4 | 15+ | 232 | 74.365086 | 73.884303 | 2.213360 |
plt.figure(figsize=(8, 5))
plt.bar(distance_error["distance_group"].astype(str), distance_error["mae"])
plt.xlabel("Trip distance group")
plt.ylabel("MAE")
plt.title("Prediction Error by Trip Distance Group")
plt.tight_layout()
plt.show()